
Exploratour - Picturebook
Mars Global Surveyor: Other data returned from Mars
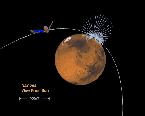
This image illustrates one way in which the magnetometer instrument studies the planet. This image also illustrates the process of aero-braking. (Courtesy NASA/JPL) |
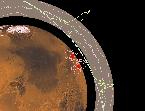
This image illustrates one way in which the magnetometer instrument studies the planet. This image also illustrates the process of aero-braking. (Courtesy NASA/JPL) |
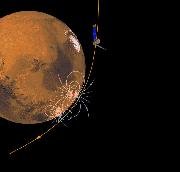
This image illustrates surface magnetic fields of Mars. (Courtesy NASA/JPL) |
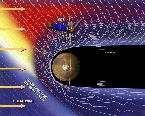
This image illustrates the Martian magnetosphere & its interaction with the solar wind. (Courtesy NASA/JPL) |
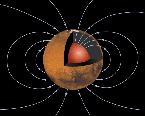
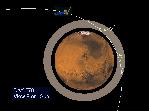
This image illustrates the global magnetic field of Mars. (Courtesy NASA/JPL) |
This image illustrates surface magnetic fields of Mars. (Courtesy NASA/JPL) |

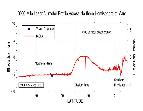
This image shows temperature data from the surface of the planet. The purple regions are the coldest, about -200 degrees F (140K), while the red areas are the warmest at about 30 degrees F (270K). (Courtesy NASA/JPL) |
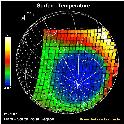
This image shows temperature data from the surface of the planet. The scale to the left shows that purple regions are the coldest, about -170 degrees F (140K), while the yellow areas are the warmest at about 17 degrees F (270K). (Courtesy NASA/JPL) |
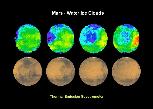
This graph shows proof of the existence of clouds of water on Mars. The sequence shows the water clouds moving across the face of Mars. (Courtesy NASA/JPL) |
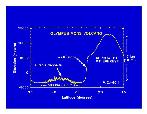
This graph shows altimeter results from Mars Global Surveyor of the size of Olympus Mons. (Courtesy NASA/JPL) |
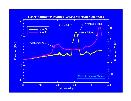
This graph shows altimeter results from Mars Global Surveyor of other volcanoes of Mars. (Courtesy NASA/JPL) |
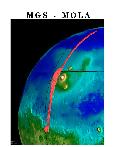
This graph shows altimeter results from Mars Global Surveyor of the size difference between the two hemispheres of Mars (northern vs southern). (Courtesy NASA/JPL) |
This graph shows altimeter results from Mars Global Surveyor of other volcanoes of Mars on the Tharsis Ridge. (Courtesy NASA/JPL) |

This graph shows a measurement of pyroxene on Mars. (Courtesy NASA/JPL) |